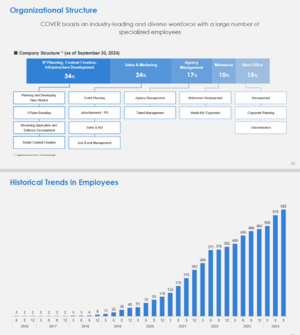


Employee data is always in their financial results. I'm bored, so here - let me spoon-feed you:
They have been slowly ramping up hiring each quarter - with studio staff included in the higher 34% mix of full-time employees for
"IP, Content Creation and Infra Dev't"
View attachment 85482
Which makes sense, you can't just hire staff willy-nilly off the streets - there's a lengthy process of vetting, onboarding and training required - especially with proprietary tech like theirs. You fill the need carefully and slowly over time and once you have an established roster of experienced techs that can provide proper mentorship on top of their regular duties, you can steadily increase hiring over time as you now have a proper infrastructure and work culture established to guide your new-hires.
Bonus AI crunched summary after translating Yen-to-USD:
Financial Performance Overview in US Dollars (USD)
Based on the provided data from "COVER_FY2025-Q2_ER.pdf", here is an analysis of Q1 and Q2 performance over the previous years, converted approximately using the rate 1 yen = $0.0067:
Total Revenue (FY2021 to FY2024)
- FY2021/3: $38.35 million
- FY2022/3: $91 million
- FY2023/3: $137 million
- FY2024/3: $202.11 million
Q2 Performance For Key Metrics (FY2025 Q2)
- Revenue: $71.62 million (YoY +49.8%)
- Gross Profit: $38.99 million (YoY +72.8%)
- Operating Profit: $17.01 million (YoY +80.2%)
- Net Profit: $10.07 million (YoY +44.9%)
Revenue Breakdown by Service (FY2025 Q2)
- Streaming/Content: $14.65 million (YoY +21.4%)
- Concerts/Events: $7.66 million (YoY -11.0%)
- Merchandising: $39.39 million (YoY +79.8%)
- Licensing/Collaborations: $9.92 million (YoY +90.1%)
YoY Growth Rates
- FY2021/3 to FY2022/3: +287%
- FY2022/3 to FY2023/3: +138%
- FY2023/3 to FY2024/3: +48%
Net Income (FY2021 to FY2024) in USD
- FY2021/3: $8.17 million
- FY2022/3: $8.33 million
- FY2023/3: $16.82 million
- FY2024/3: $27.72 million
Operating Cash Flows in USD
- FY2021/3: $9.51 million
- FY2022/3: $23.5 million
- FY2023/3: $32.61 million
- FY2024/3: $31.93 million
Cash and Cash Equivalents at End of Period in USD
- FY2021/3: $12.73 million
- FY2022/3: $31.12 million
- FY2023/3: $52.20 million
- FY2024/3: $58.86 million
Subscriber Growth (Total Number of Channel Subscribers in Millions)
- Q1 FY2021/3: 1.003 million
- Q1 FY2022/3: 4.418 million
- Q1 FY2023/3: 6.525 million
- Q1 FY2024/3: 9.225 million
- Q2 FY2021/3: 1.808 million
- Q2 FY2022/3: 5.081 million
- Q2 FY2023/3: 7.002 million
- Q2 FY2024/3: 9.362 million
Summary of Performance
- Record Revenue Growth: The revenue for Q2 FY2025 at $71.62 million signifies a considerable YoY growth of 49.8%. This growth trend is consistently observable in both quarterly and annual assessments.
- Net Income Spike: The net income experienced a significant jump from $8.17 million in FY2021/3 to $27.72 million in FY2024/3, showcasing substantial profitability growth over the years.
- Service-Specific Revenue: Merchandising has emerged as the largest revenue segment in Q2 FY2025 with $39.39 million, reflecting an impressive 79.8% YoY growth.
- Subscriber Base Expansion: The total number of channel subscribers has grown significantly, reaching 9.362 million by Q2 FY2024/3, reflecting the expanding audience and market reach.
TL;DR: Learn to read and use tools to analyze a fucking financial document instead of regurgitating the ramblings of whichever anti-corpo schizo you happen to be sucking off this evening.


